StatLab Zim — build story
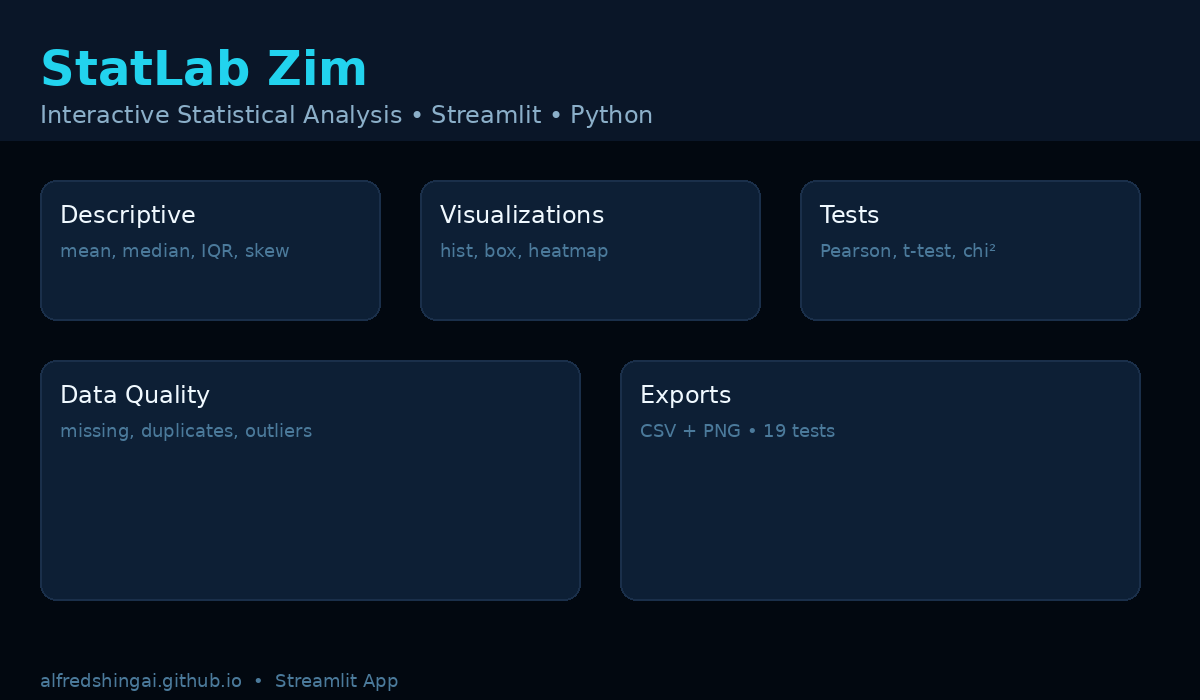
An interactive statistics lab: upload a CSV, get descriptives, charts, and hypothesis tests with plain-language decisions. Live on Streamlit Cloud, MIT-licensed, 19 tests.
The question
Introductory statistics tools are closed, complex, or lecture-only. My classmates at UZ needed SPSS for coursework that was really just: describe this data, test that hypothesis, interpret the result. SPSS is licensed, intimidating, and teaches you nothing about the shape of your data.
The question: can a browser tab replace a stats-practical session?
What I built
- Upload anything — messy real-world files: missing cells, duplicate rows, mixed types, dates stored as text.
- Data-quality check first — row/column counts, missing-value %, duplicate detection, type inference, before any statistics.
- 13-metric numeric summary — mean, median, IQR, skew, kurtosis, CV and more, computed honestly on whatever survived the quality gate.
- Six interactive Plotly charts — histogram, boxplot, bar, scatter, line for dates, heatmap.
- Five tests with plain-language decisions — Pearson, Spearman, linear regression with trendline, Welch t-test, chi-square. Not "p = 0.032" — "the relationship is probably real."
- CSV/PNG exports via kaleido.
The hard part was not the statistics
It was the empty file with only a header. On day one, pandas.read_csv crashed on an empty file — no rows, no columns — and my data-quality summary tried to count inferred types on an empty DataFrame. The user saw a red traceback instead of a helpful message.
if type_summary.empty:
    n_numeric = n_categorical = 0
    # show "Header but no data rows. Visualizations will be limited."
Properly is not about adding features. It's about handling the boring edge so the human on the other side feels respected.
Testing before shipping
I wrote 19 pytest tests before I felt comfortable shipping: row/col counts, missing-value percentages, duplicate detection, numeric detection, descriptive spot-checks with pytest.approx — and crucially, empty/invalid file handling. The suite caught a real bug where is_object_dtype returned False for pandas 2's new StringDtype.
What it taught me
Edge cases are the product. The 90% happy path is commodity; trust is won in the broken-file 10%.
Plain language is a feature. Every test result ships with a decision sentence, because a p-value without context is just a number.
Ship small, test first. 19 tests bought more confidence than any amount of manual clicking.
Tech stack: Python, Streamlit, pandas, SciPy, Plotly, pytest, kaleido.