Bike Sales Analysis
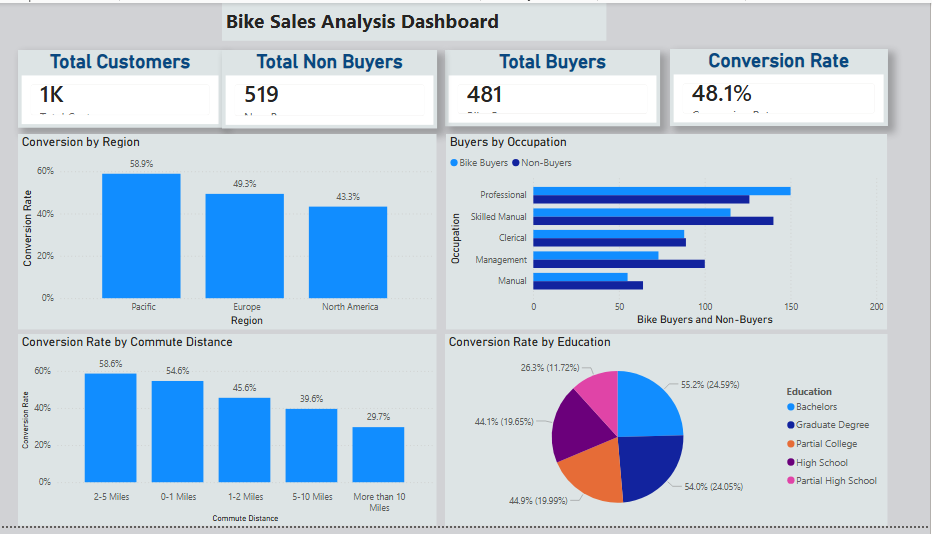
1,000 customers. One clear segment. A dashboard built to answer a manager's question in 10 seconds, not 10 minutes.
The question
A bike retailer knows who bought. It doesn't know who actually buys — and more usefully, who doesn't. The dataset: 1,000 customer records with income, demographics, commute distance, region, and purchase outcome.
The approach
- Clean in Excel, prototype in pandas. Duplicates removed, "Married"/"Single" normalized, age bands cut in both tools so the numbers could be cross-checked.
- Segment before you visualize. Purchase rate by income band, age bracket, commute distance, and region — each pivot answering one question.
- Build the dashboard around the decision: who to target, where, with what message.
Findings
The Pacific segment converts
High-income, middle-aged professionals in the Pacific converted at ~59% — not the largest segment, but the most valuable per customer.
Buyers and non-buyers are not opposites
The useful difference wasn't demographic extremes — it was commute distance and car ownership interacting with income. Targeting on income alone would have wasted budget.
Designed for one question
Slicers limited to region, age, commute. Every visual earns its place by answering the targeting question. No decorative charts.
Decisions worth defending
Why duplicate the cleaning in Excel and pandas?
Because stakeholders trust Excel and I trust pandas. Cross-checking both caught a normalization discrepancy before it reached the dashboard — and made the deliverable auditable in the stakeholder's own tool.
Why so few slicers?
Every extra slicer is a decision the viewer has to make. The dashboard answers "who do we target" — filters that don't sharpen that answer are deleted.
What I'd do differently
1,000 rows is small. Segment-level conversion estimates carry wide confidence intervals. I'd report uncertainty next to every percentage now.
Revenue, not just purchase rate. A buyer's value varies. Next version models purchase value, not just incidence.
Tech stack: Excel (Power Query, pivots), Python (pandas), Power BI (DAX). Repo includes cleaning workbook, notebook, and PBIX.