Coca-Cola USA Retailer Analysis
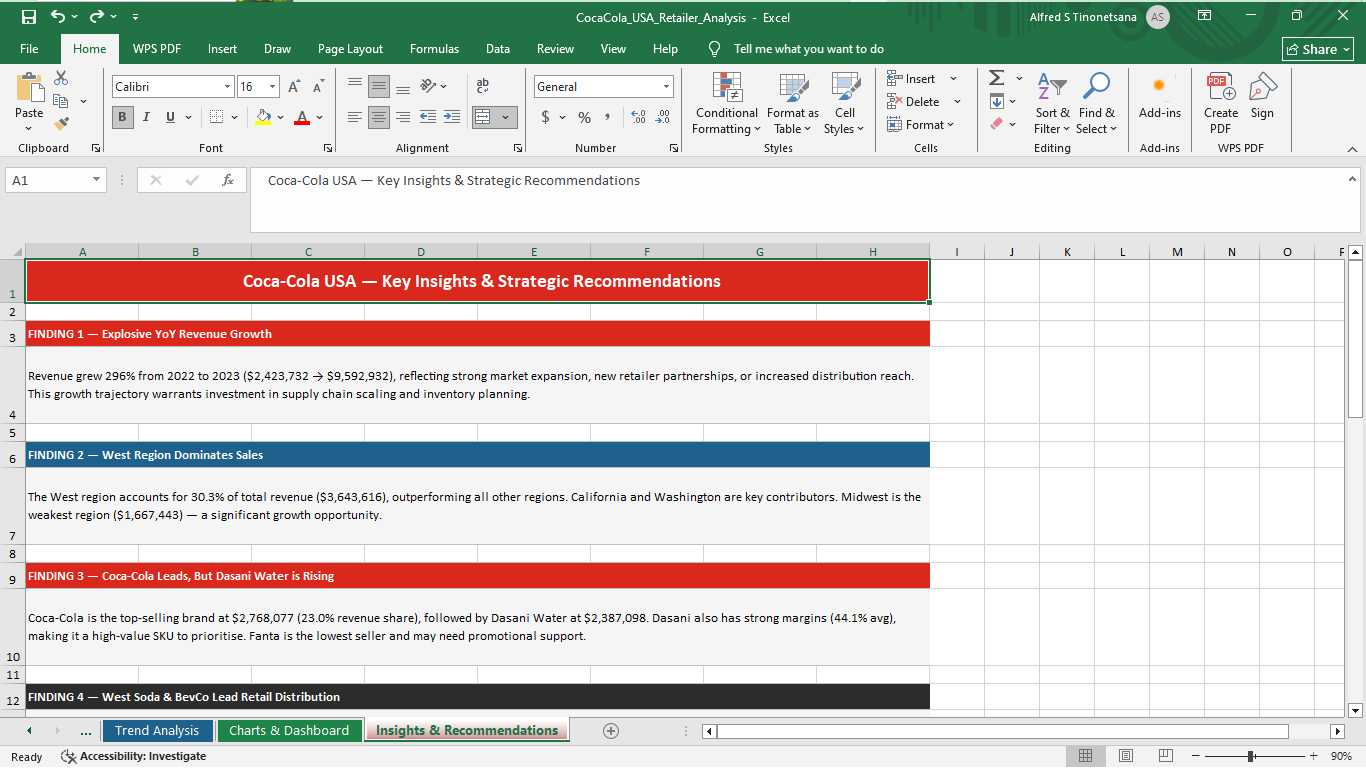
9,648 retailer invoices from 2022–2023. The story wasn't "sales went up" — it was which retailer type moved which pack size where.
The question
Two years of retailer invoices: every line an order with brand, pack size, unit price, volume, region, and retailer type. Management saw a revenue total. The useful questions were underneath: which retailer types drive which brands, in which pack sizes, in which regions?
The approach
- Power Query as the cleaning room. 9,648 rows typed, trimmed, de-duplicated, and reshaped — region names normalized, pack sizes parsed from product strings, invoice dates fixed from serials.
- Segment before summarizing. Revenue by retailer type × pack size × region matrix built as pivot scaffolding before any chart.
- One page per decision: revenue trend, brand profitability, regional distribution.
Findings
Channel is destiny
A handful of retailer types carried the majority of volume — but the margin story sat with different channels than the volume story. Treating "top retailers" as one block hides exactly this.
Pack size is regional
Multi-pack formats concentrated in specific regions and channels. The same product line performs differently by geography — distribution, not demand, explained most of the gap.
The trend line hides the story
Aggregate revenue growth was steady. Split by channel, one segment declined through 2023 while another grew — the average was two stories canceling out.
What I'd do differently
Ask for the unit economics earlier. Without cost data, "profitability" was proxy-driven. One conversation with the stakeholder would have sharpened the whole analysis.
Version the cleaning. I'd snapshot each Power Query stage today, so "what changed" between drafts is answerable.
Tech stack: Excel, Power Query, pivot analysis. Workbook and documentation in the repo.