Kevin Cookie Company
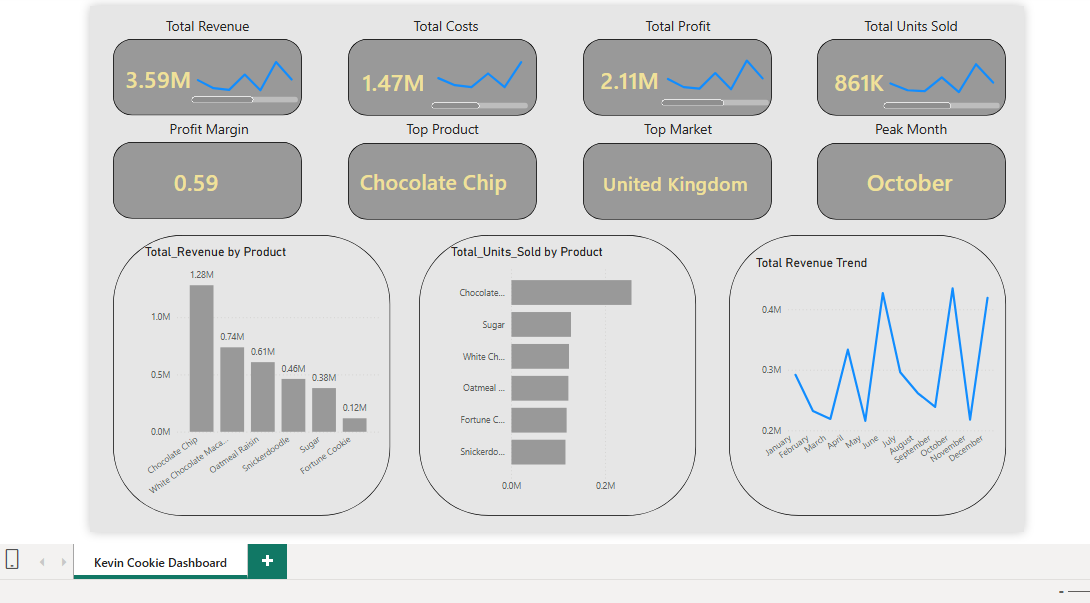
KPIs prototyped in pandas, implemented in Excel, delivered in Power BI. 2020 international performance — when "international" mostly meant "how did we cope with 2020?"
The question
A small exporter's 2020: which markets grew, which collapsed, and which costs moved with them? The dataset — orders, units, revenue, cost per market across the year — is small enough to hold in your head and messy enough to punish assumptions.
The approach
- Prototype in pandas. Revenue, units, margin, and month-over-month KPIs computed first in Python — fast to iterate, impossible to fat-finger the way a 40-step SUMIFS chain can be.
- Rebuild in Excel. Same KPIs in SUMIFS/Pivot language so the client could audit every number in their native tool.
- Deliver in Power BI. The dashboard is the read-only view; the workbook and notebook are the audit trail.
Findings
Markets diverged sharply
"International" was not one story — a couple of markets grew through 2020 while others fell off a cliff. Aggregate KPIs hid both.
Cost moved differently than revenue
Unit costs spiked in months where revenue dipped — the margin squeeze was a logistics story, not a demand story.
Three tools, one truth
pandas, Excel and Power BI agreed on every KPI — because each was cross-checked against the others. That reconciliation was the quality assurance.
What I'd do differently
Parameterize the year. Hardcoded 2020 filters made the refresh story harder than it needed to be.
Ship the reconciliation. The pandas-vs-Excel check deserves its own page in the write-up — it's the part stakeholders ask about.
Tech stack: Python (pandas), Excel (SUMIFS, pivots), Power BI (DAX). Notebook, workbook, and PBIX in the repo.