Data Analyst & Builder · Harare, Zimbabwe

All the tables.
One clear story.

I'm Alfred. I clean, model, and visualize data — then I build the product: dashboards, statistical tools, and open data APIs, from raw export to decision-ready insight.

Python · Power BI · Excel Seeking Data Analyst roles ● 3 products live on the internet
3
Live products
6+
Case studies
19
Pytest tests
BSc
Applied Stats, UZ — Final Year
2
Internships
Tools I use daily

What I work with

Data & Querying
Python
Pandas
NumPyNumPy
SciPy
Streamlit
FastAPI
Jupyter
Visualisation & BI
Power BI
Excel
DAX
Power Query
Plotly
Building & Shipping
ETL Pipelines
REST APIs
Data Quality
Pytest
Open Data
Open Source
Analytics Methods
Data Cleaning
EDA
Dashboard Design
Data Storytelling
Hypothesis Testing
§
Selected work

Products first. Analysis underneath.

Everything here is live, documented, or open source — and all of it was cleaned, modeled, and shipped by me alone.

—
2026 · FastAPI · ETL · Open data · MIT

SokoData

Open market-price intelligence for African food markets.

What does maize cost today — in Harare, or in any of the hundreds of markets WFP publishes across Africa? The data exists, scattered across WFP, national agencies, and a dozen formats: raw CSVs and PDFs, no unified API. SokoData turns that scatter into one clean, documented, queryable API — African market prices at its core, plus a deep Zimbabwe data commons (economy, climate, demographics). 22 datasets, all open data, provenance per record.

Live right now: 486 markets, 31 commodities, daily USD price movers, CPI, exchange rates, fuel, and climate series — one ETL per dataset, one catalog, and analytics hardened by the world's messiest currency history.

PythonFastAPIPandasETLWFP · World Bank · Open-Meteo
—
2026 · Data engineering · ODbL · MapLibre

Who Builds Africa

A source-tracked database of foreign participation in African infrastructure.

An open database documenting who finances, designs, builds, and operates African infrastructure — across any period, including pre-2000 and archived sources. Neutral by design: if evidence only shows financing or equipment supply, the record says exactly that. Every material claim links to a source, a verbatim passage, and an evidence-strength label.

The product is the database, not the map: JSON Schema validation with pydantic and Frictionless, PR-reviewed curated data, and versioned releases in CSV / GeoJSON / GeoPackage / SQLite. The interactive map (Astro, Svelte, MapLibre) is just the exploration layer.

PythonJSON SchemaFrictionlessMapLibreAstro
—
Python · Machine learning

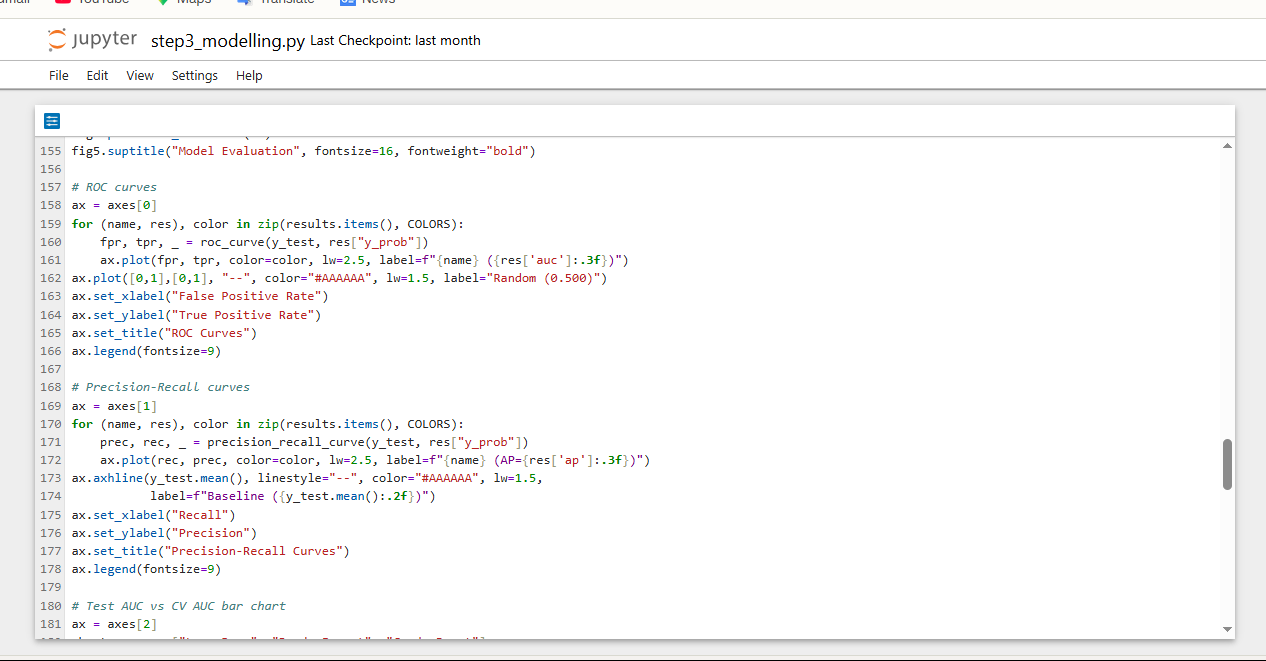
Bank Customer Churn Prediction

AUC 0.868. But the insight is cheaper than the model.

Bank churn analysis

End-to-end pipeline: EDA → feature engineering → gradient boosting. The model finds at-risk customers, but the EDA finds why — tenure, balance, and activity patterns that a branch manager can act on tomorrow.

Data cleaningEDAGradient boosting
Read the case study →
Excel · Python · Power BI

Bike Sales Analysis

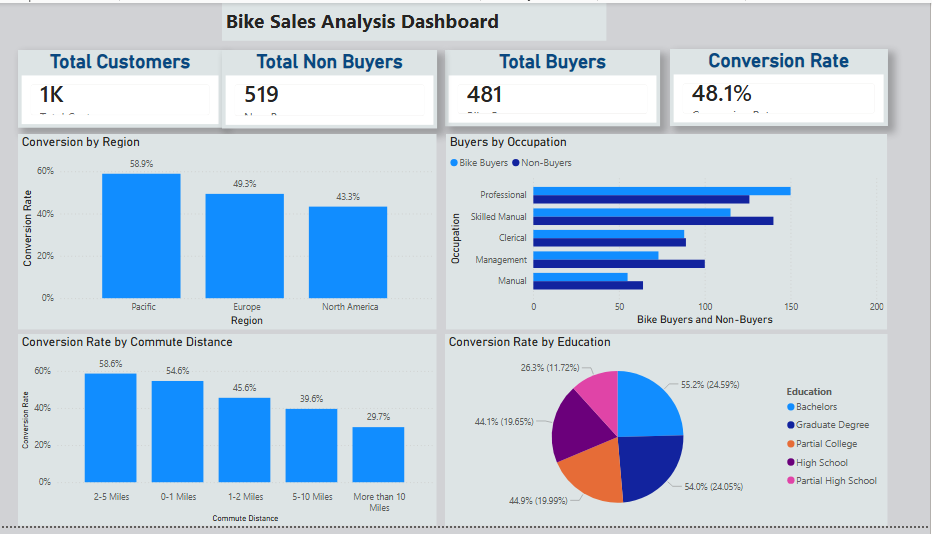
1,000 customers. One clear segment.

Bike sales dashboard

Analyzed 1,000 records to find who actually buys. High-income, middle-aged professionals converted at ~59% in the Pacific — not the largest segment, but the most valuable. The dashboard answers a manager's question in 10 seconds, not 10 minutes.

PythonPandasExcelPower BIDAX
Read the case study →
Power BI · DAX · Power Query

Flight Status Dashboard

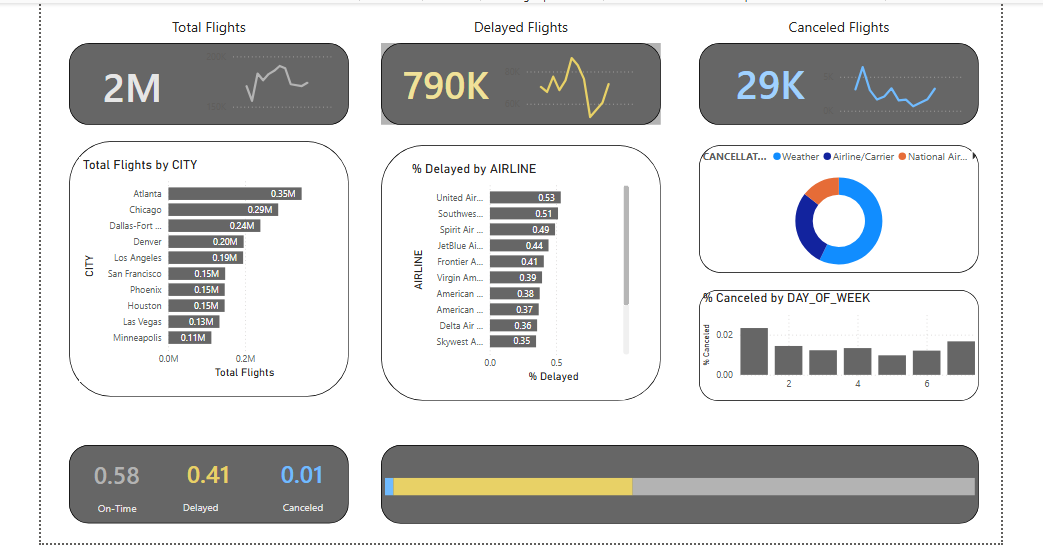
Flight status dashboard

U.S. airline and airport performance across delays, cancellations, on-time rates. The stakeholder question was simple: "Which airline should we rebook on?" The answer needed one filter, not five.

Power BIDAXPower Query
Read the case study →
Excel · Power Query · 9,648 records

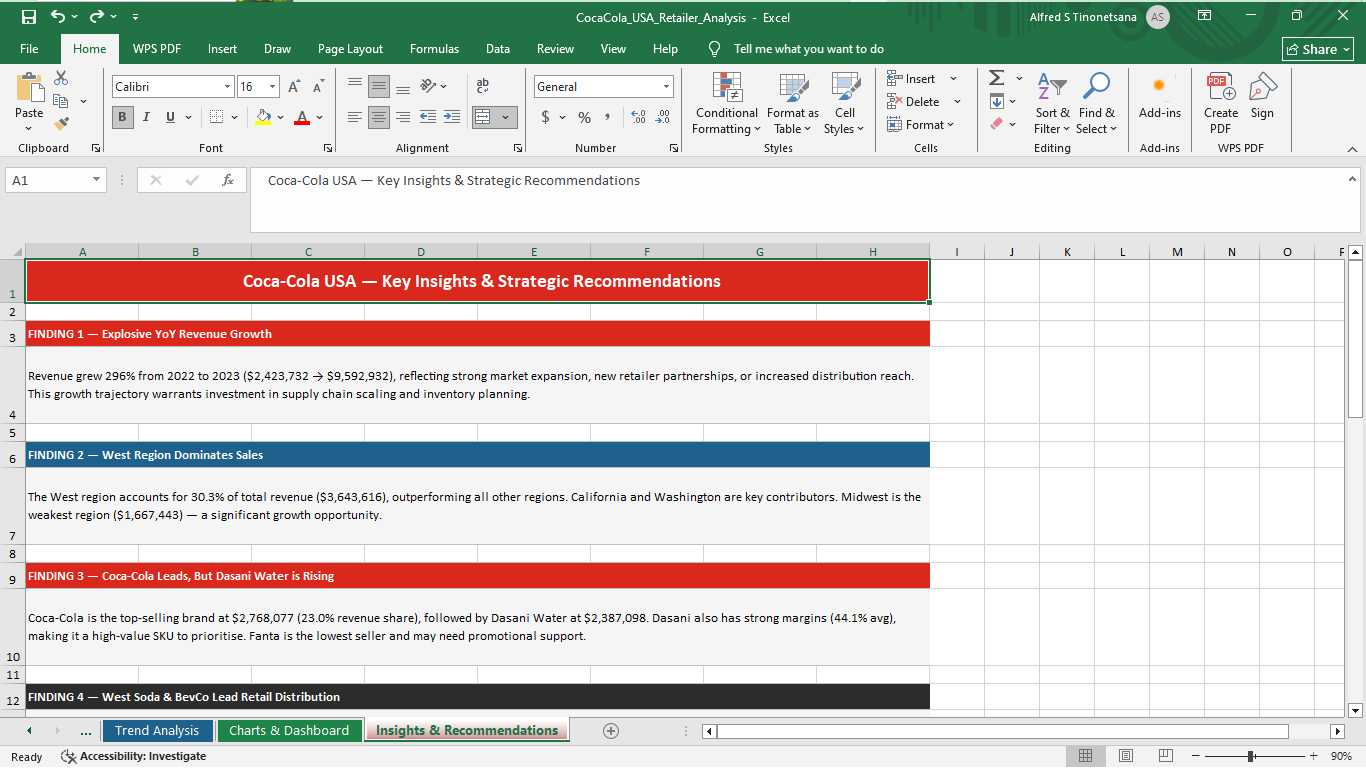
Coca-Cola USA Retailer Analysis

Coca-Cola retailer analysis

2022–2023 retailer invoices: revenue trends, brand profitability, regional distribution. The story wasn't "sales went up" — it was which retailer type moved which pack size where.

ExcelPower QueryData cleaning
Read the case study →
Power BI · Python · Excel · 2020

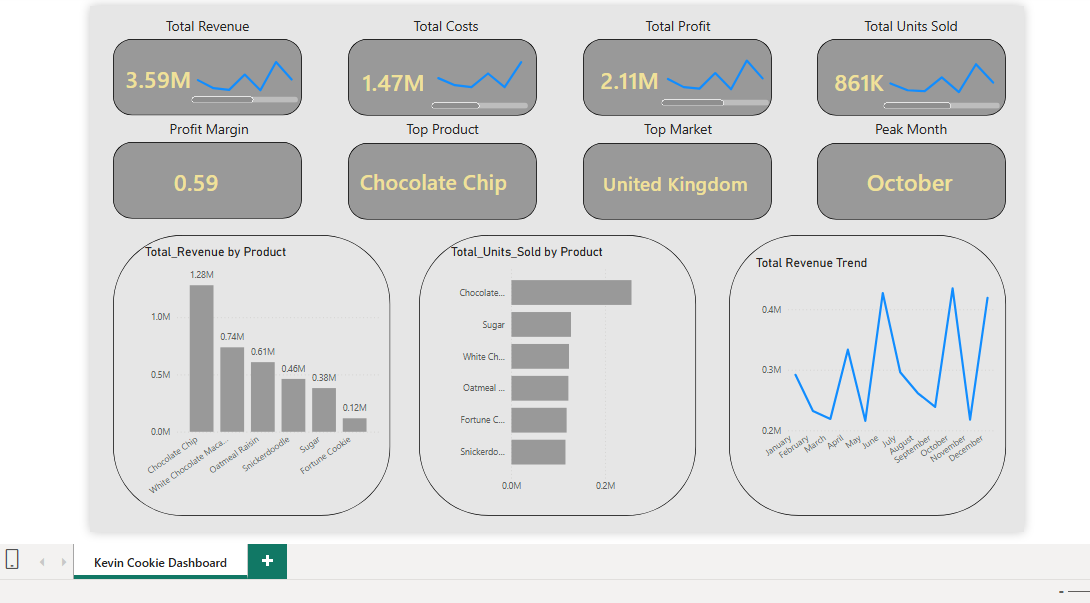
Kevin Cookie Company

Kevin Cookie dashboard

Prototyped KPIs in pandas, implemented in Excel, delivered in Power BI. 2020 international performance — when "international" mostly meant "how did we cope with 2020?"

SUMIFSPandasDAX
Read the case study →

Want the notebooks and source code behind all of this?

Explore all repositories →
§
Writing

Thinking, out loud.

Notes on building data products, statistics without the jargon, and shipping small.

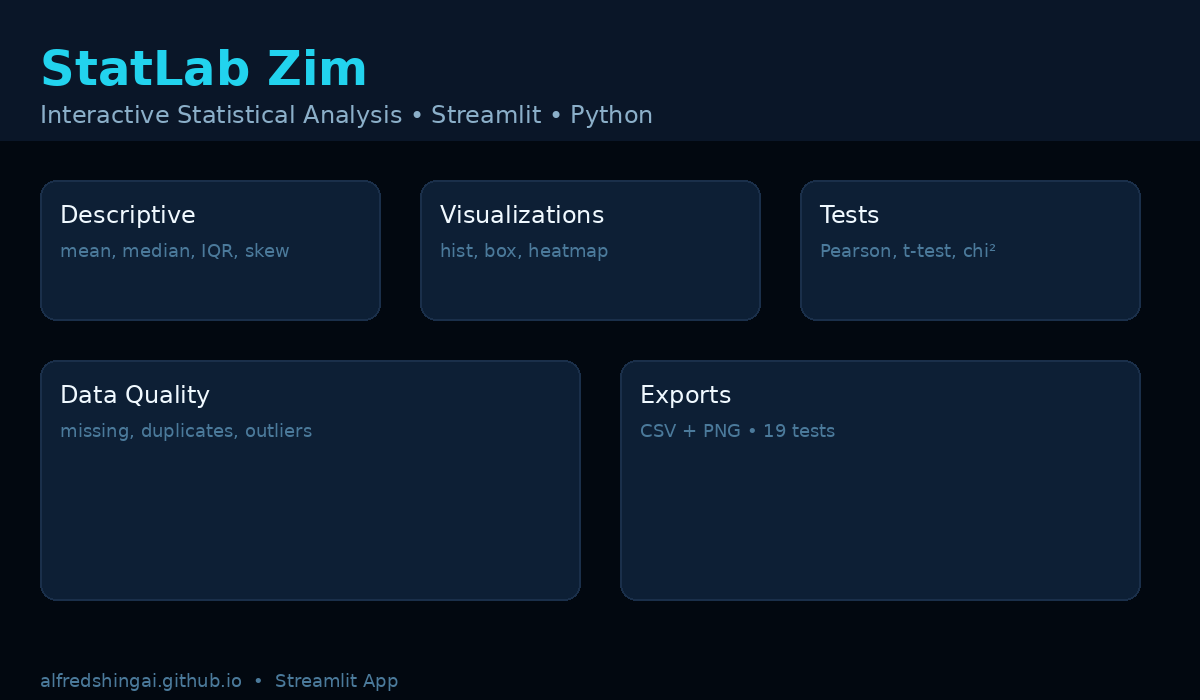
What building StatLab Zim taught me about "properly"

19 tests, empty-header edge cases, and why shipping small beats perfect planning.

Read →

Lean web components: warm paper, 7 variables, no framework

How I rebuilt my site with a handful of CSS variables and no build step.

Read →

Atomic Habits — notes for an analyst who loves systems

1% improvements, mapped to data cleaning and shipping small.

Read →
§
Story

Career changer, yes.
Beginner, no.

I ran spreadsheets long before I ran models.

2024 — Present

Applied Statistics, University of Zimbabwe

BSc Final Year

Statistical inference, regression, experimental design. Where I learned that a p-value without context is just a number — and that a good chart answers the question before it's asked. StatLab Zim started as a study aid for classmates.

2023 — 2024

Data Analyst Internships — 2 placements

Power BI · Excel · Python

Sole analyst on retail and finance data: cleaned 10k+ rows, modeled with DAX and Power Query, shipped dashboards that replaced weekly manual reporting. Learned how systems with real stakeholders work — and how they fail.

Since 2023

Independent — StatLab, SokoData, Who Builds Africa

Everything under Selected work, shipped solo

Three live products, five analyst case studies, hundreds of commits. The tools change; the job stays the same: ask the right question, keep the data honest, and make the insight obvious.

Built as an analyst first, designer second. Harare, Zimbabwe — available remote or in-office.

Let's build something

Open to interesting problems, collaborations, and conversations about data, dashboards, or the next StatLab feature.